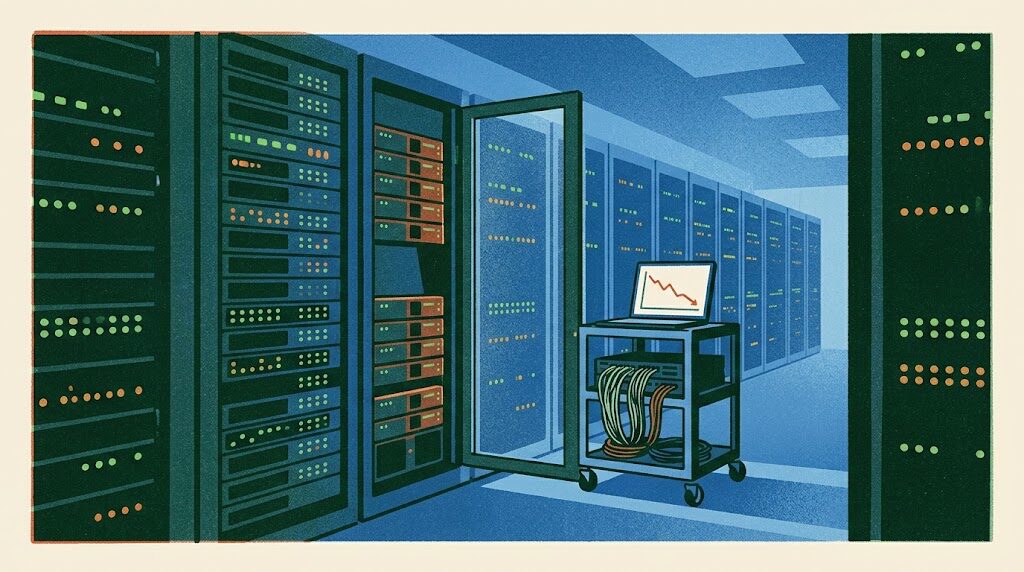
It used to be fast
When the app launched, every page loaded instantly. That was with a few thousand records and a handful of customers. Now there are millions of rows, customers with years of history, and reports nobody imagined in the first version. The dashboard takes eight seconds. An export times out. The database server sits at high CPU all afternoon and nobody is quite sure which part of the app is doing it.
This is a good problem to have. It means the business worked. Your team built something people use more and more, and the code they wrote was right for the size it was. It just wasn’t written for the size it is now.
The usual response is to buy a bigger server. That helps for a few months, costs more every month, and leaves the real cause in place.
What I do: measure first
I don’t change anything until I know where the time goes. Guessing at performance is how teams spend a month on a cache that saves forty milliseconds while the real problem sits elsewhere.
- Look at real traffic. Your APM (New Relic, Datadog, Scout, Skylight, AppSignal) or, if there isn’t one, set one up. Which endpoints are slow, how often, and for whom.
- Read the query plans.
EXPLAIN ANALYZEon the slow queries, to see whether Postgres is scanning a whole table, sorting in memory, or picking a bad plan. - Find the N+1 queries. One query per row in a list, hidden inside a view or a serializer. They’re the most common cause of slow Rails pages and usually the cheapest to fix.
- Add the missing indexes, and remove the ones that only slow down writes. On large tables, indexes are built concurrently so nothing locks.
- Fix counts and totals on huge tables.
COUNT(*)over hundreds of millions of rows is slow by nature. Counter caches, estimates or summary tables usually solve it. - Cache what’s safe to cache, with a clear rule for when it expires.
- Move slow work to background jobs. Exports, emails, imports and recalculations don’t need to happen while a customer waits.
- Tune Postgres itself: memory settings, connection pooling, autovacuum on busy tables, and the slow-query log.
Every change gets a before and after number. If a change doesn’t move the number, it comes back out.
Numbers, written down
The point of this work is that your team understands what changed and can keep it fast. So everything goes into the repo:
- Performance notes: each fix, the query or page it touched, and the timings before and after.
- A plain-language overview of where the app’s load comes from and which tables are the big ones.
- Runbooks for checking the slow-query log, reading a query plan, and adding an index safely on a large table.
- Decision notes on what was tried and rejected, and what to watch as data keeps growing.
- Instructions for AI assistants, so agents working in your code know the performance rules too, such as how to avoid N+1s and which tables need care.
You own all of it, along with any monitoring I set up.
Why me
For seven years I was a senior engineer on a multi-tenant B2B SaaS that grew from about $4M to $13M in annual revenue. I ran its roughly 1TB Postgres database, and I cut the company’s AWS bill by six figures a year, much of it by making the app do less work rather than buying more hardware. I’ve written about some of that on my writing page, including counting 800 million rows and tracking down 319 N+1 queries across a fleet of apps.
Take a business like this one
The business in this section is a composite of the kind of company I talk to, not a named client. The numbers are the shape of the problem, not a case study.
Picture a property management platform on Rails and Postgres, used by a few hundred management companies. The largest customers have tens of thousands of units and years of payment history. Their owner statements page takes twelve seconds, the monthly export fails for the three biggest accounts, and the database instance has been upsized twice in a year. Smaller customers are fine, so the team has trouble reproducing the problem.
What I’d do for a business shaped like this:
- Week one: measure. Turn on detailed tracing for the slow endpoints and the slow-query log, and copy a large customer’s data shape into a safe environment to reproduce it.
- Fix the statements page. In a case like this it’s usually an N+1 inside a loop over units, plus a missing composite index on payments. Measure after each change.
- Move the monthly export to a background job that emails a link when it’s done, so it can’t time out.
- Replace live totals on the payments table with a summary that updates as payments arrive.
- Tune Postgres for the real workload, and check whether the second upsize can be undone.
- Write it up. Performance notes with every number, runbooks, and AI-assistant instructions, so the team keeps it fast as the next large customer arrives.
The team keeps doing what they’re best at: building the features property managers ask for.
What it costs
It starts with a small fixed-price assessment: a week of measuring and a written report naming the slowest parts of your app, the likely causes, and what fixing each would take. Many teams fix the first few items themselves from the report. The work after that is scoped from what we find. No retainer, and no surprise invoices.
What I need from you
Access to the code, your APM or logs, and read access to production metrics. A copy of production data, or a sanitized one, to test against. A developer on your side to review changes and learn the tools. And your list of the pages customers complain about most, because that’s where we start.